Oscilloscope pictures
Lissajous Curve
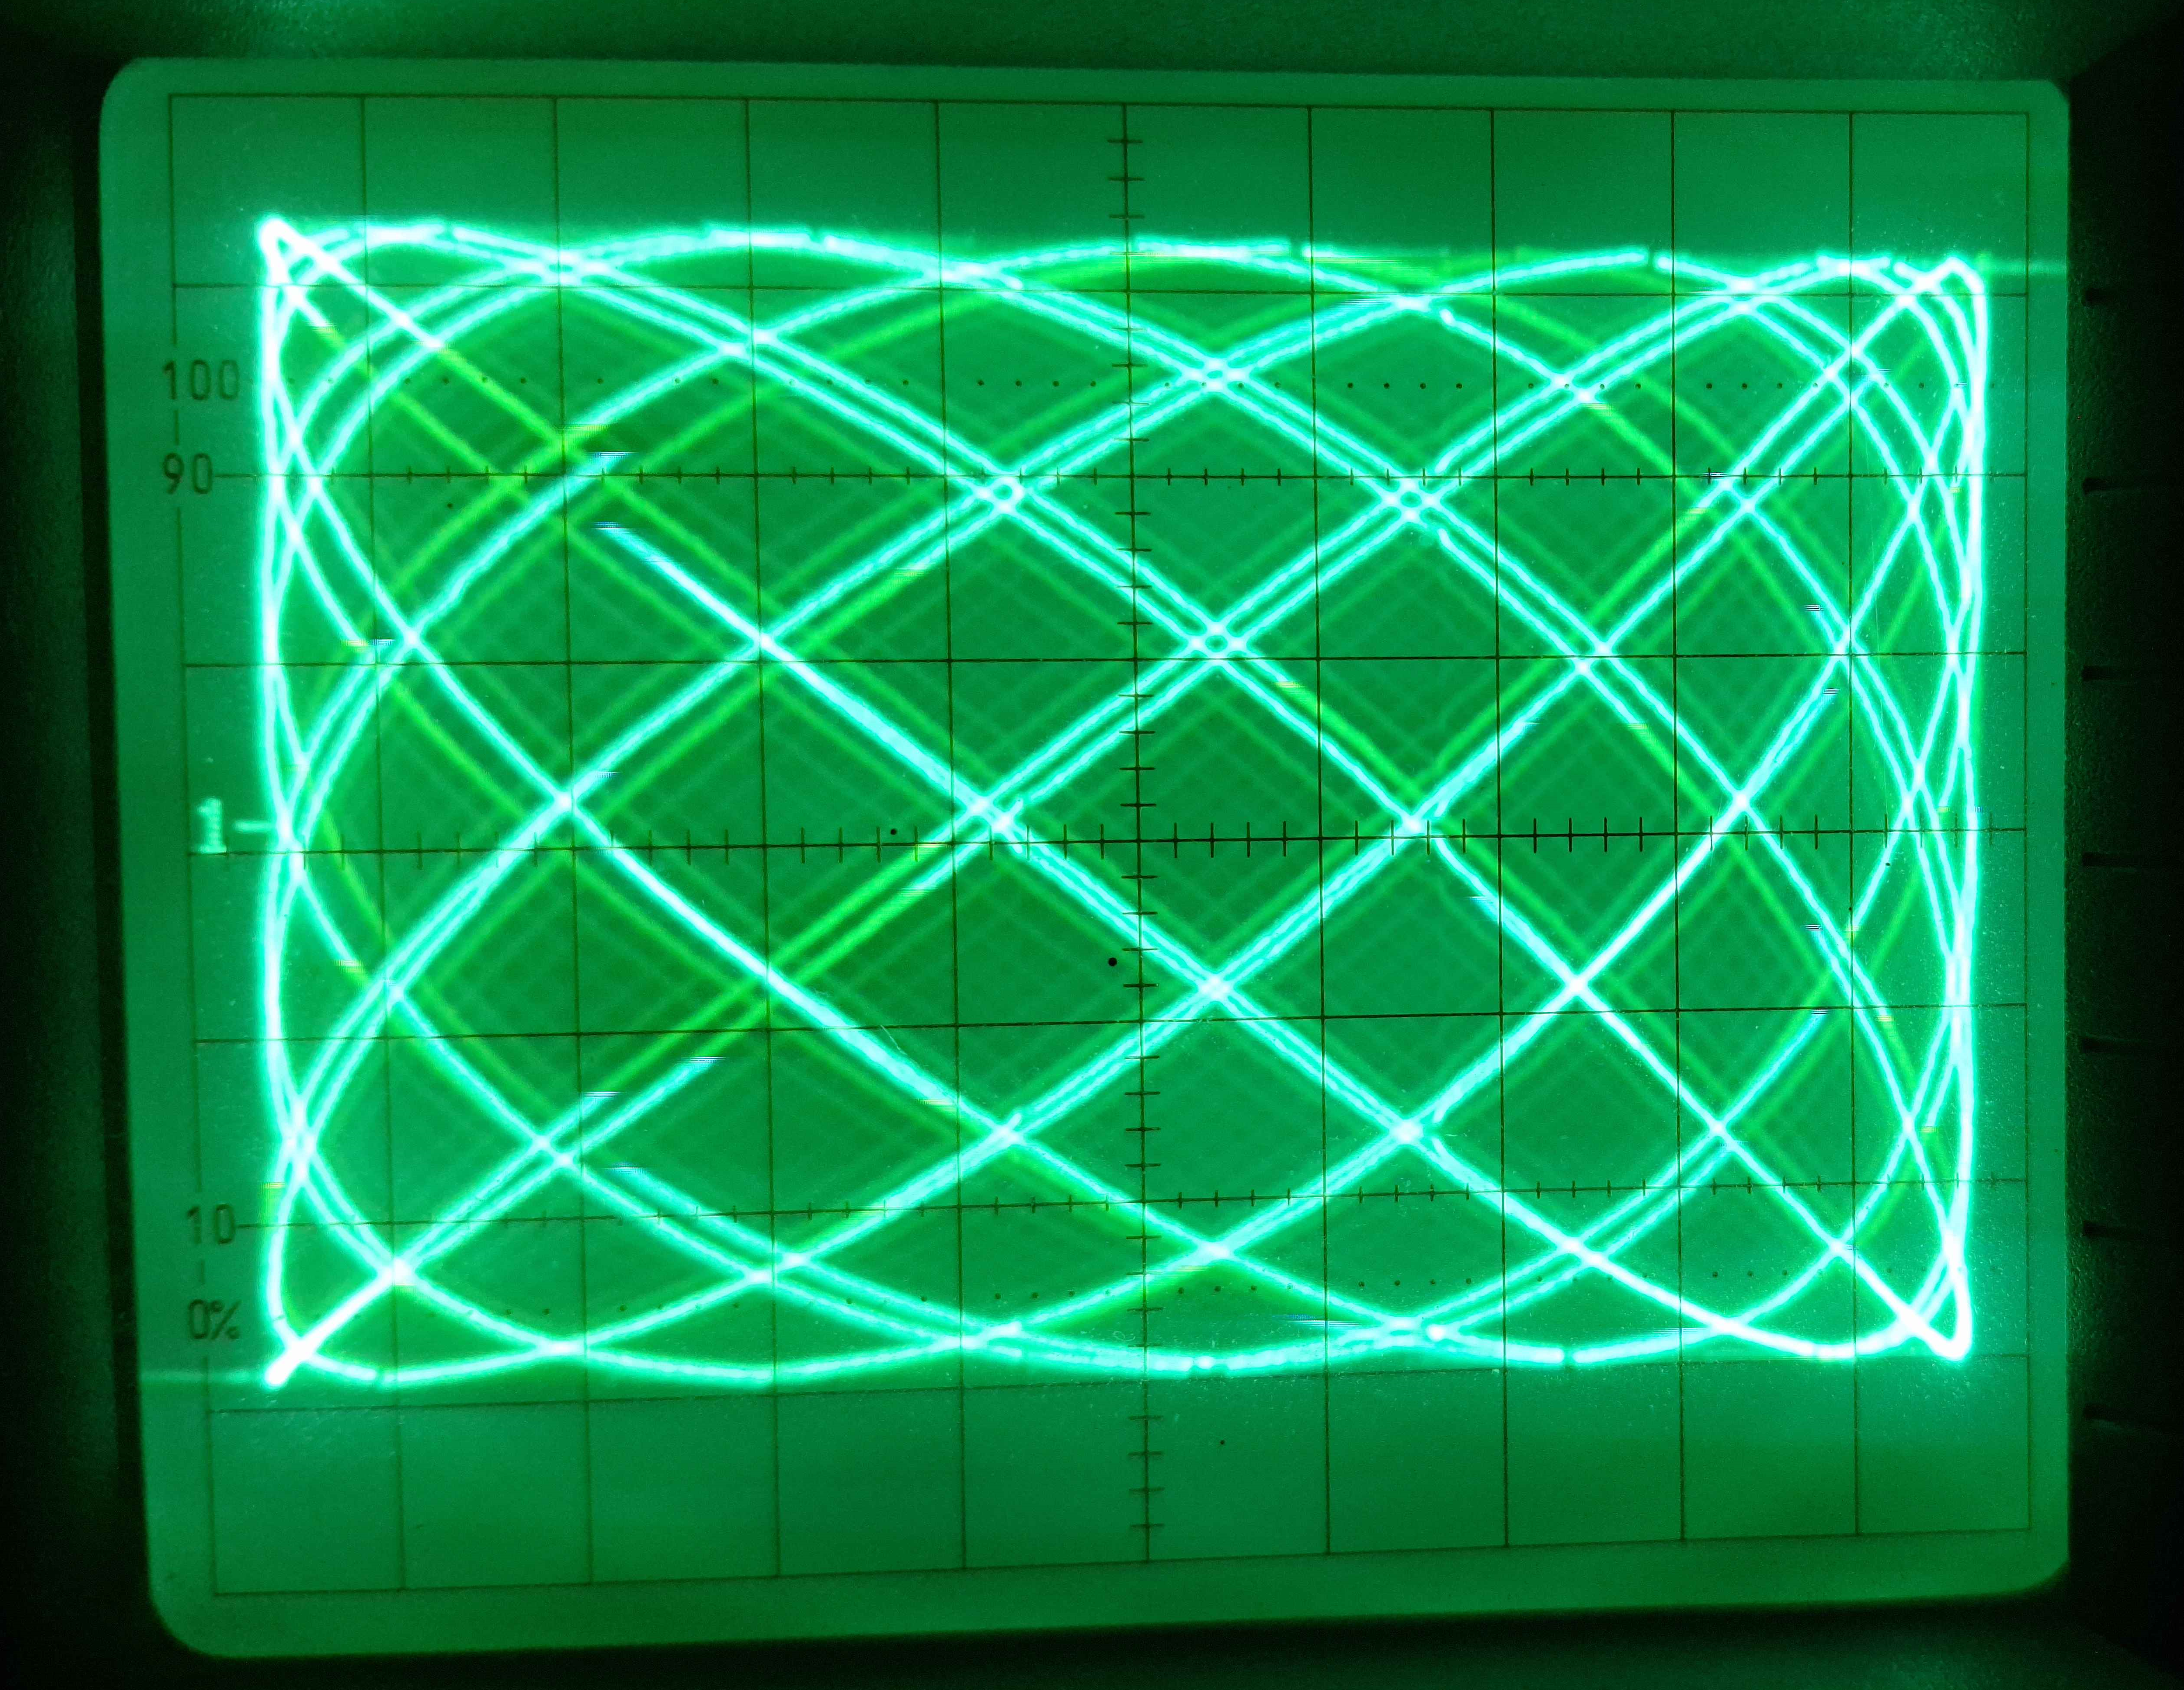
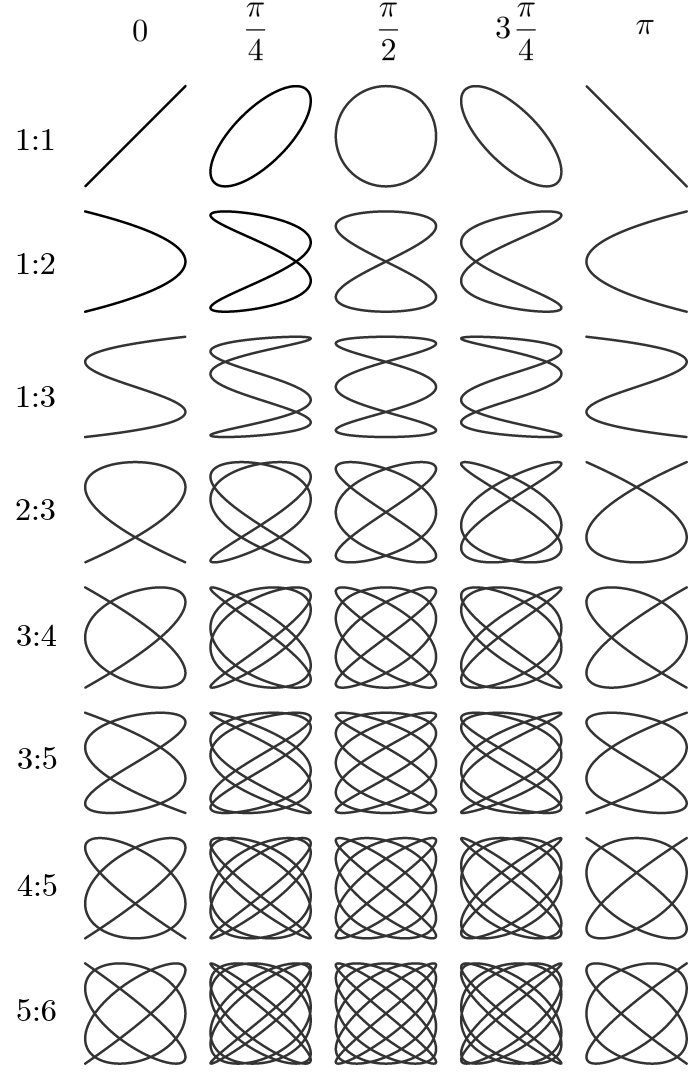
A Lissajous Curve is a way to compare two sine waves.Typically, it's made by plotting two sine curves against each other. The resulting Pattern can be compared with a diagram (2) to estimate the frequency ratio and the phase change.
In this case (1) it's made with a 400Hz sine Curve for the x-axis and a 500Hz sine wave as the y-axis. The resulting 5/4 relation closely compares with a 90° turned version of 4/5.